Power and uptime
Running on a production centre since 2026-10-01: HPE iLO and Dell iDRAC servers read over Redfish, a Cisco NX-OS switch read over NX-API, website checks, cost for the month, and the module switch.
Available from Ballast 1.0.3.
Power and uptime is an item in the tree with two tabs. Dashboard shows what your equipment draws now and over time, what that costs for the month, and the hottest reading anywhere. Uptime checks that the services you depend on are answering. Both are read by the centre itself, not by the host agents.
It is an optional module. It is on by default, and can be switched off under Settings, Modules.
Dashboard
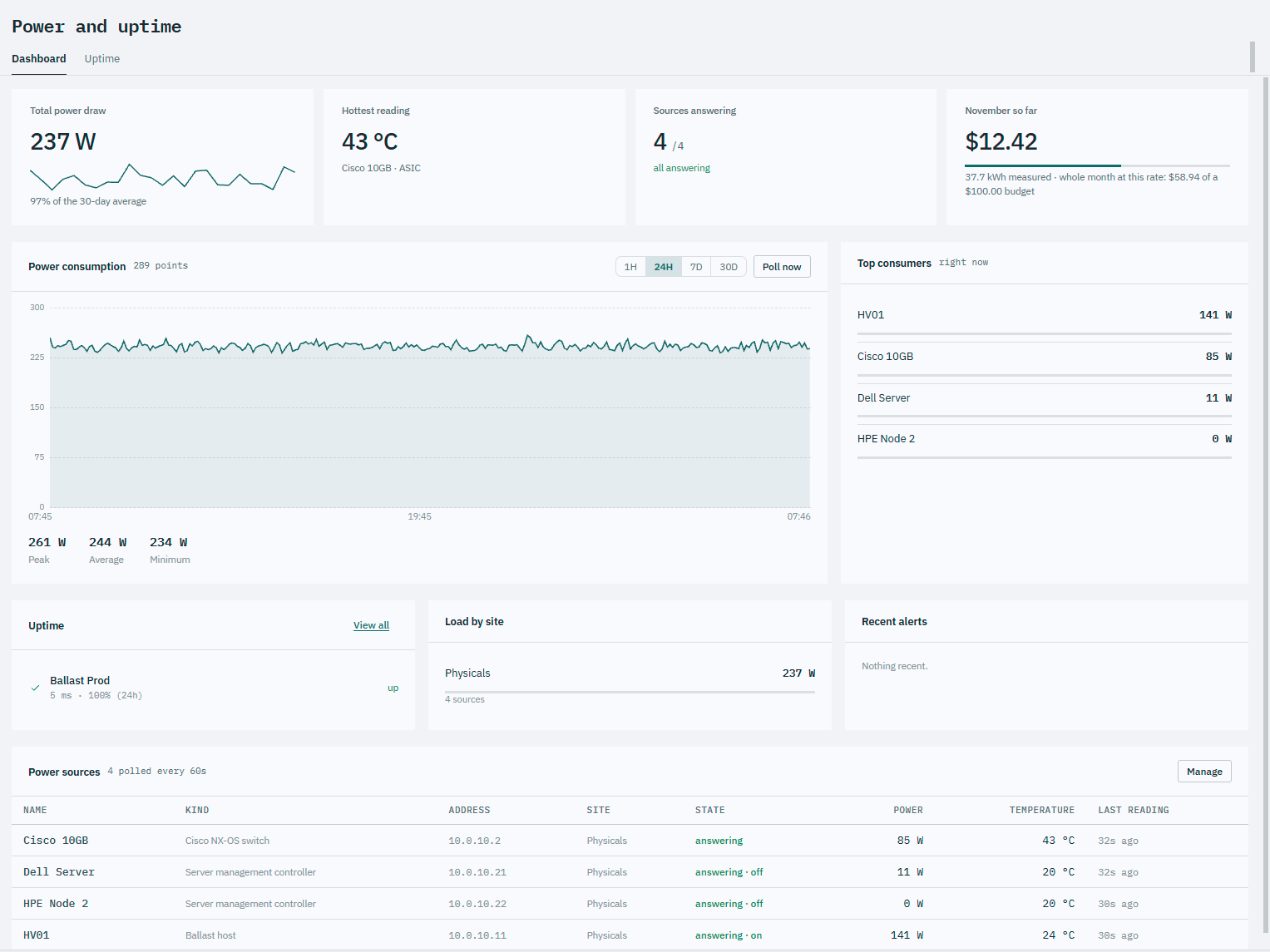
| Panel | What it shows |
|---|---|
| Total power draw | What every source answering draws now, against the 30-day average. |
| Hottest reading | The highest temperature reported, and which device and sensor it came from. Temperatures from unlike sensors (a switch ASIC, a server inlet) are never averaged together. |
| Sources answering | How many power sources replied to the last reading. |
| This month | Energy measured this month, as cost when a tariff is set and as CO₂ when a grid carbon intensity is set, with a projection for the whole month and your budget. |
| Power consumption | A chart over the last hour, day, week or 30 days, with peak, average and minimum. Poll now takes a reading straight away. |
| Top consumers | The biggest draws right now. |
| Load by site | Draw per site. |
| Uptime and Recent alerts | A summary of the Uptime tab and of this module's alarms. |
| Power sources | Every source, its address, site, state, power, temperature and when it last answered. |
A device that answers but publishes no power figure, such as a Sophos firewall, is shown as not reporting power. It is left out of every total rather than counted as 0 W. A server that is switched off but whose management controller still answers reports what the controller measures, which can genuinely be 0 W.
Where readings come from
| Source | How it is read | What it gives |
|---|---|---|
| A Ballast host | Its management controller, over Redfish. | Power and temperature. Nothing to add: a host is read as soon as it has a management controller, using the same address and credential that powers the host on. |
| Server management controller | Redfish: HPE iLO, Dell iDRAC, Lenovo XCC or Supermicro. | Power and temperature, and Power on. For servers that are not Ballast hosts. |
| Cisco NX-OS switch | NX-API over HTTPS. NX-API has to be enabled on the switch (feature nxapi). | Input power and temperature. |
| Sophos firewall | SSH, reading sensors. The firewall's SSH host key is pinned on first contact. | Temperature only. |
Every reading is made by the centre, so the centre needs to reach each address.
Verified on real equipment so far: HPE iLO, Dell iDRAC and Cisco NX-OS. The Sophos reader has been tested against a simulated device only.
Adding devices
Open Settings, Power and uptime.
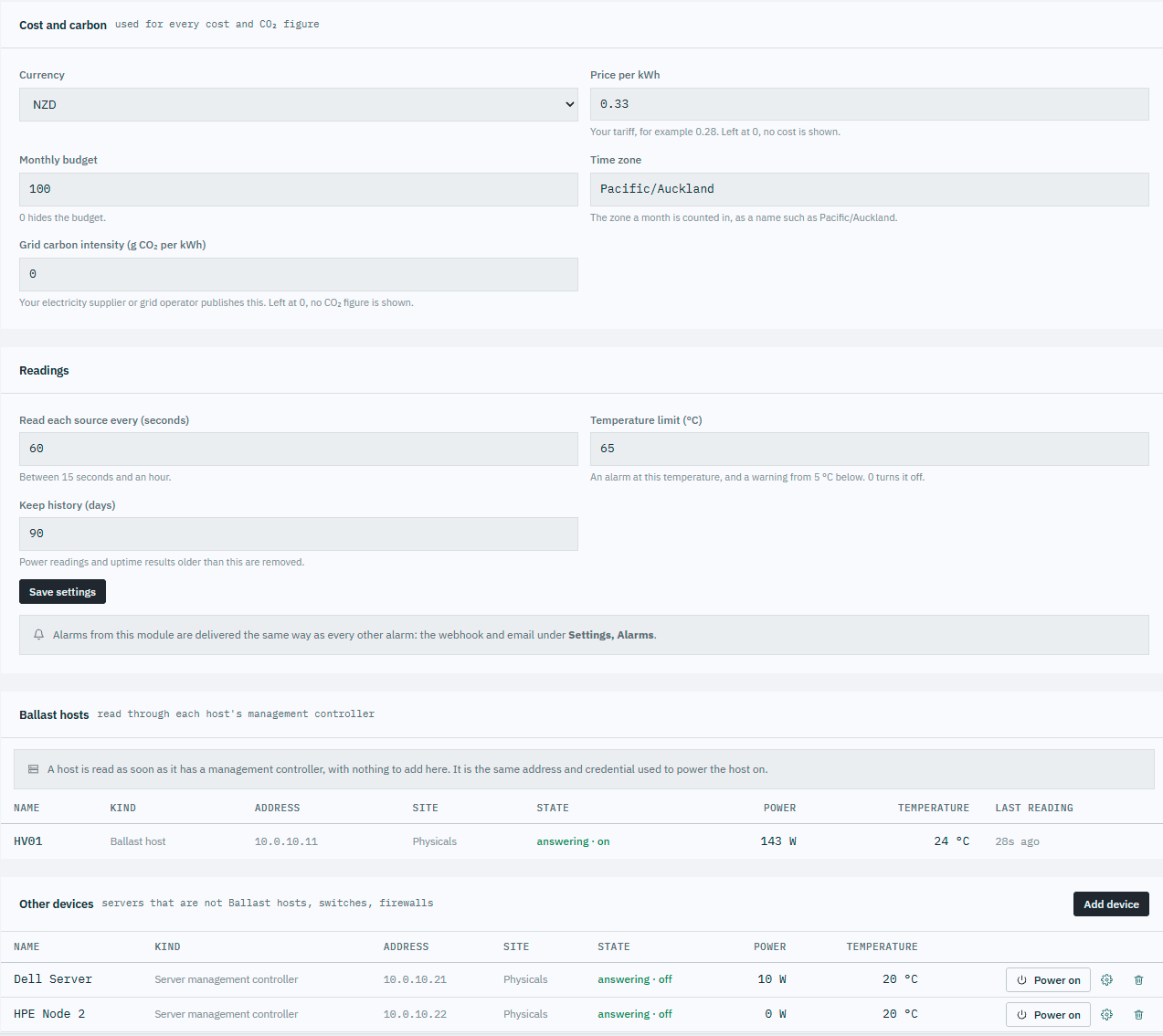
- Ballast hosts are listed for you. Give a host a management controller (its BMC settings) and it is read from then on.
- Other devices, Add device: a name, the kind, the address, a site and a credential. Switch and firewall accounts use the switch or firewall account credential type, under Settings, Credentials.
- Power on is offered for a server management controller, as it is for a host. Ballast powers on only. It never powers a device off or restarts it.
Settings
| Setting | What it does |
|---|---|
| Currency, Price per kWh | Your tariff. Left at 0, no cost is shown. |
| Monthly budget | Drawn against the month's projection. 0 hides it. |
| Time zone | The zone a month is counted in, as a name such as Pacific/Auckland. The month always starts at midnight in this zone, wherever the centre itself runs. |
| Grid carbon intensity | Grams of CO₂ per kWh, from your supplier or grid operator. Left at 0, no CO₂ figure is shown. |
| Read each source every | Between 15 seconds and an hour. |
| Temperature limit | An alarm at this temperature and a warning from 5 °C below. 0 turns it off. |
| Keep history | Power readings and uptime results older than this are removed. |
Uptime
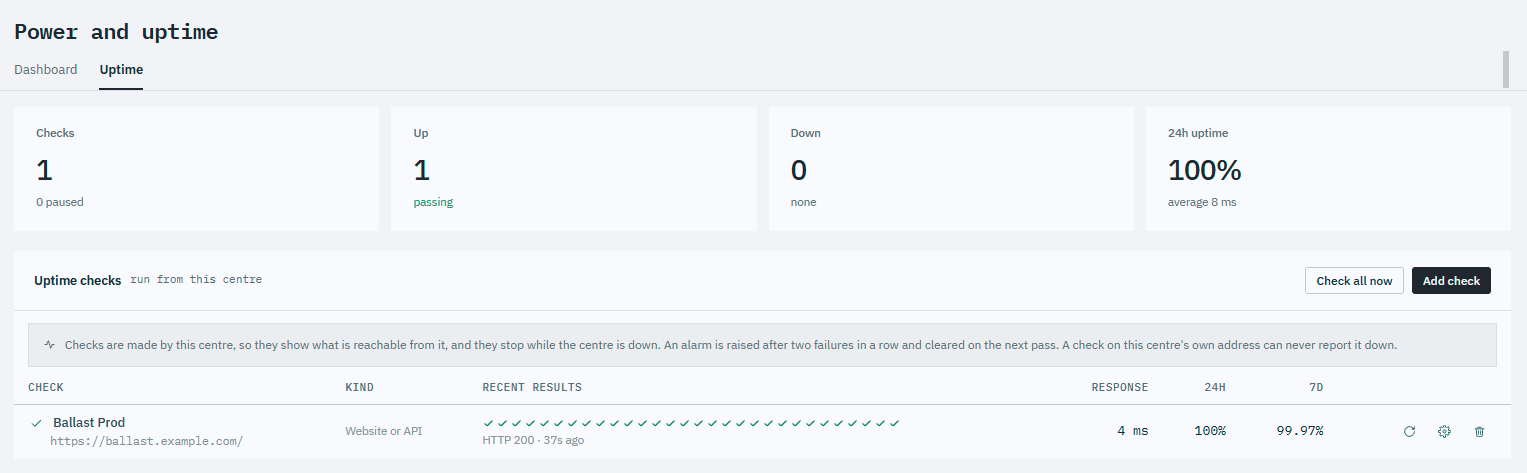
Add check and choose a kind:
| Kind | Passes when |
|---|---|
| Website or API | The address answers below HTTP 400, or with the exact status you give. |
| TCP port | The port accepts a connection. |
| Ping | One ICMP echo is answered. |
| DNS name | The name resolves from the centre. |
| Certificate expiry | The certificate is valid. It warns the number of days before expiry you set. |
| TCP banner | The service greets the connection, such as an SMTP or SSH banner. |
Each check shows its recent results as ticks and crosses, its response time, and its uptime over 24 hours and 7 days. Select a check's history for a longer view.
Checks are made from the centre. They show what is reachable from the centre, and they stop while the centre is down: a gap in the record means the centre was not checking, not that the service was down. A check on the centre's own address can never report the centre as down, so check the centre from somewhere else.
Ping needs the centre to be allowed to send ICMP. On Linux an unprivileged
service can only do that when its group is in net.ipv4.ping_group_range. If it
is not, the check says so and names the setting. A TCP port check needs no
such permission.
Alarms
The module raises alarms for:
- a power source that stops answering,
- a temperature at the limit, and a warning from 5 °C below it,
- an uptime check that fails twice in a row (cleared on the next pass),
- a certificate close to expiry.
They are delivered the same way as every other alarm: the webhook and email under Settings, Alarms.
Switching the module off
Settings, Modules has a switch for each optional module. With Power and uptime switched off:
- no readings or checks are made,
- its alarms clear at the next alarm pass,
- its tree item and settings page are hidden,
- what it already recorded is kept, and is there again when it is switched back on.
The Modules page itself is always present, so a module can never be switched off into a state where the way back is hidden.
Who can do what
| Role | Can |
|---|---|
| Administrator | Everything, including cost and carbon settings and the module switch. |
| Operator | Add, change and remove devices and checks, run checks and power on. Not the cost and carbon settings, and not the module switch. |
| Read-only | View the dashboard and uptime. |